Trains near a Perris home: what the records show
The FRA inventory lists 16 public at-grade crossings in or near Perris. 9 report trains between 6 PM and 6 AM, and 0 sit in a quiet zone. Most activity here is light rail and commuter service; the busiest crossing reports 16 trains a day.
FRA data retrieved November 9, 2026 · latest record update 2026-06-18
Illustrative AI-generated landscape · not a photo of the searched property
- Night trains9 crossings · 90% of activeVERY COMMON
- Quiet zones0 crossings · 0%NONE
- Top timetable speed60 mph
- Count freshness9 of 10 counted 2021+RECENT
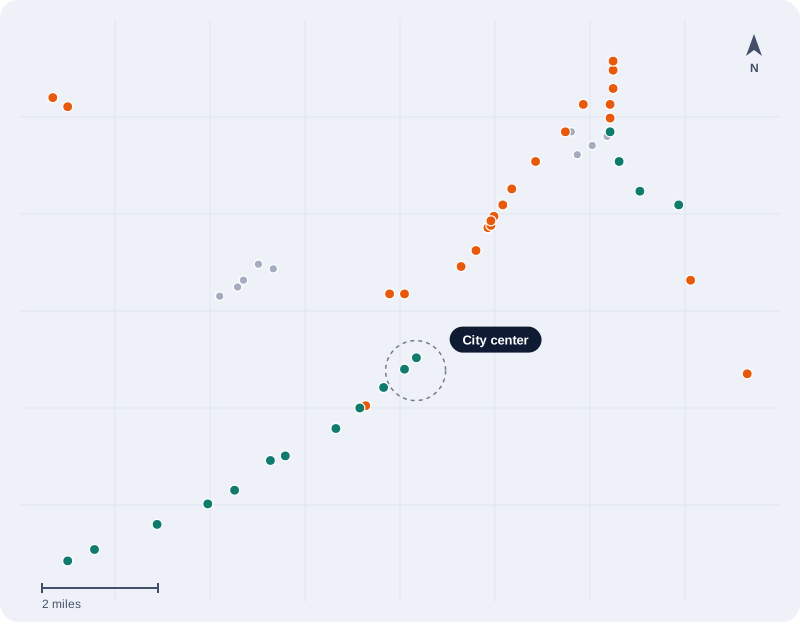
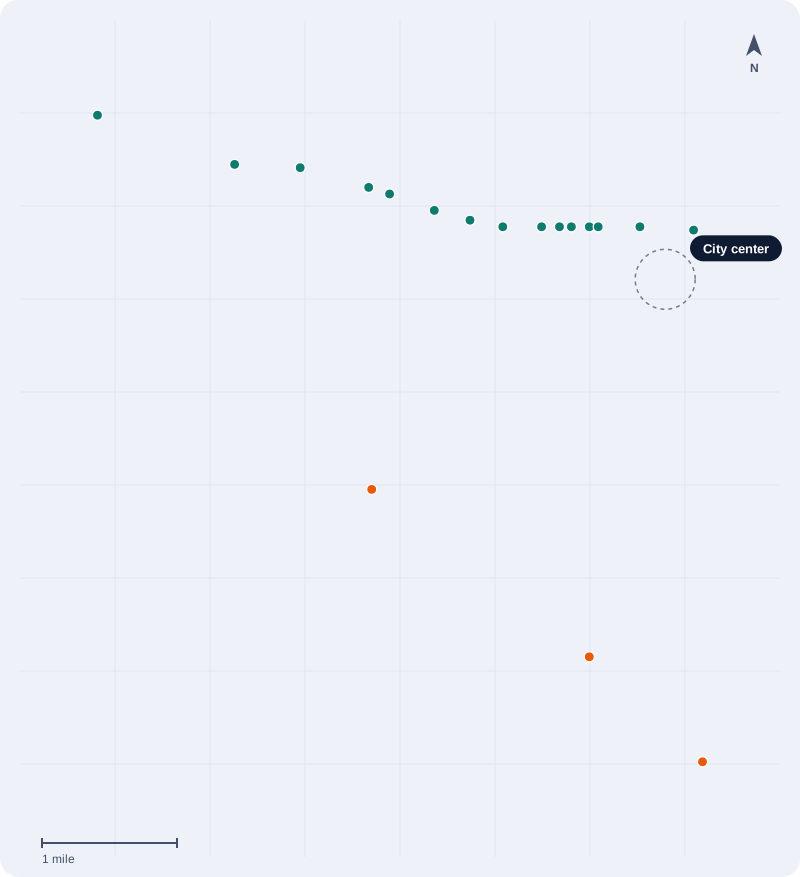
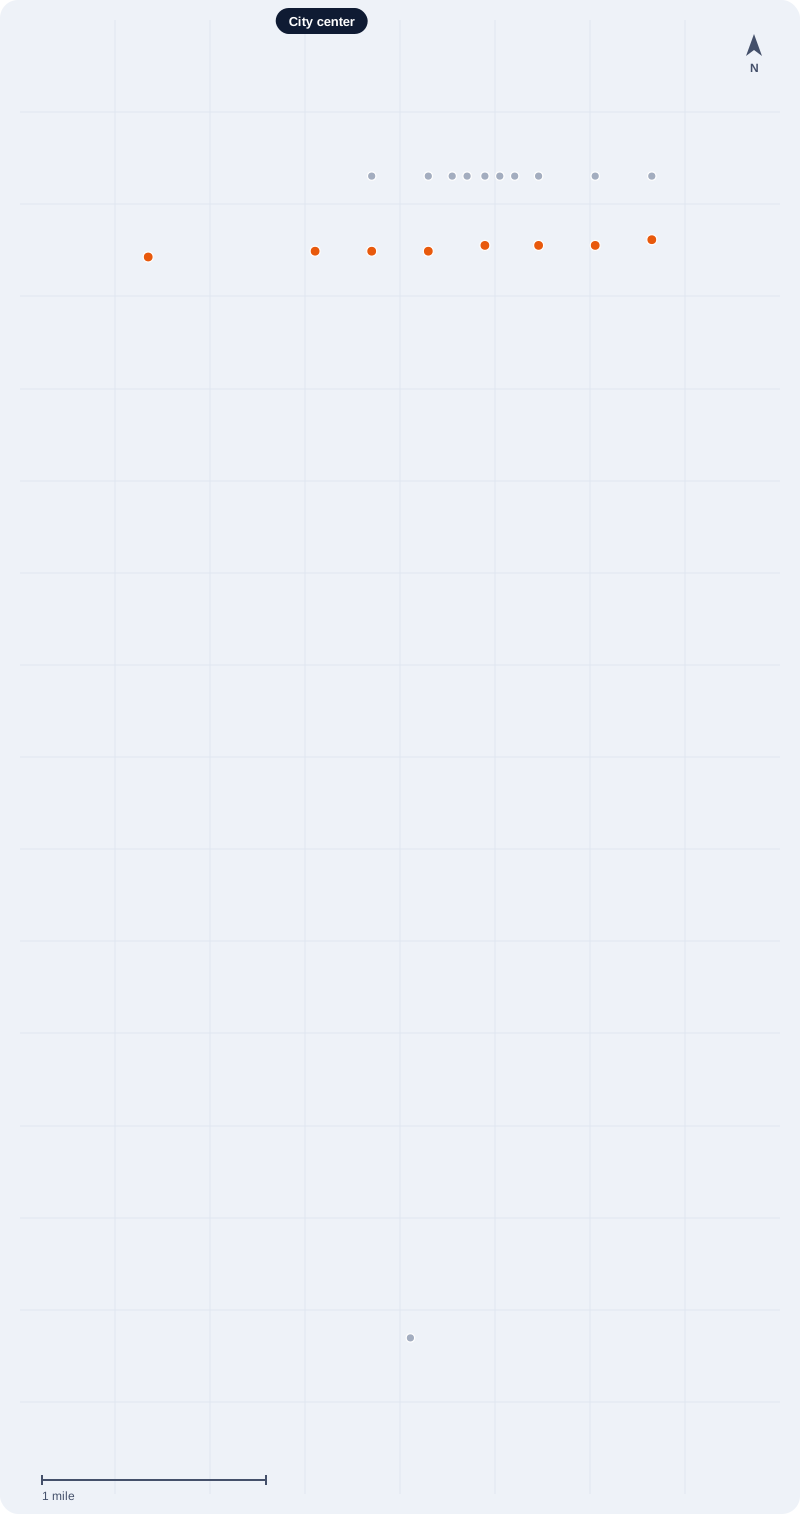
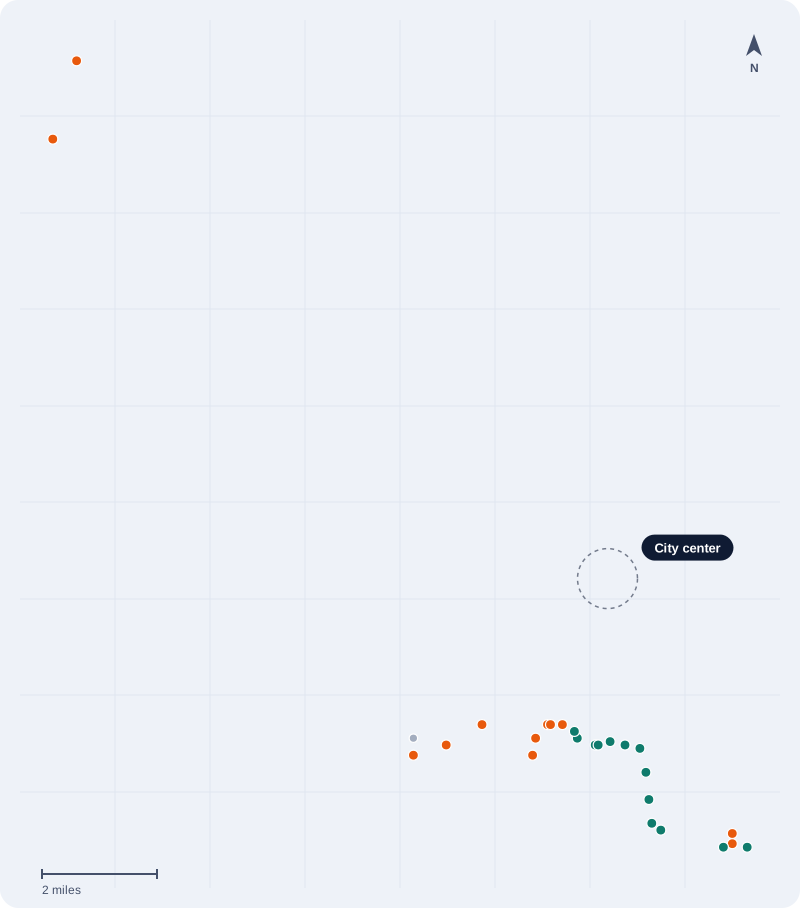
Where Perris's crossings are
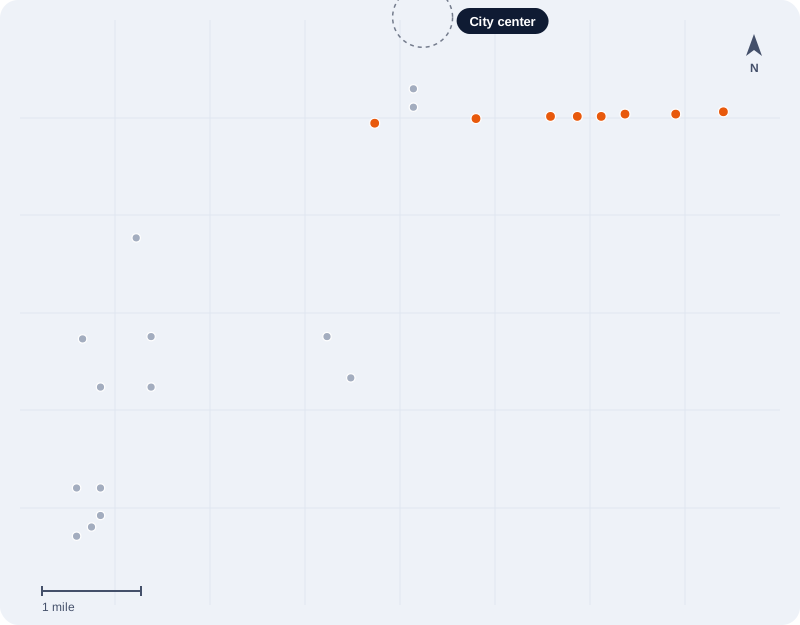
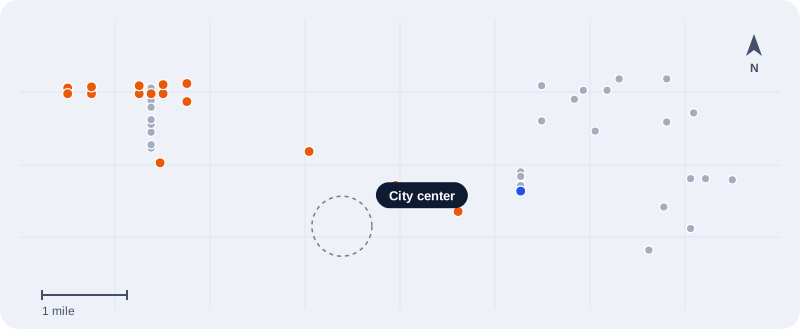
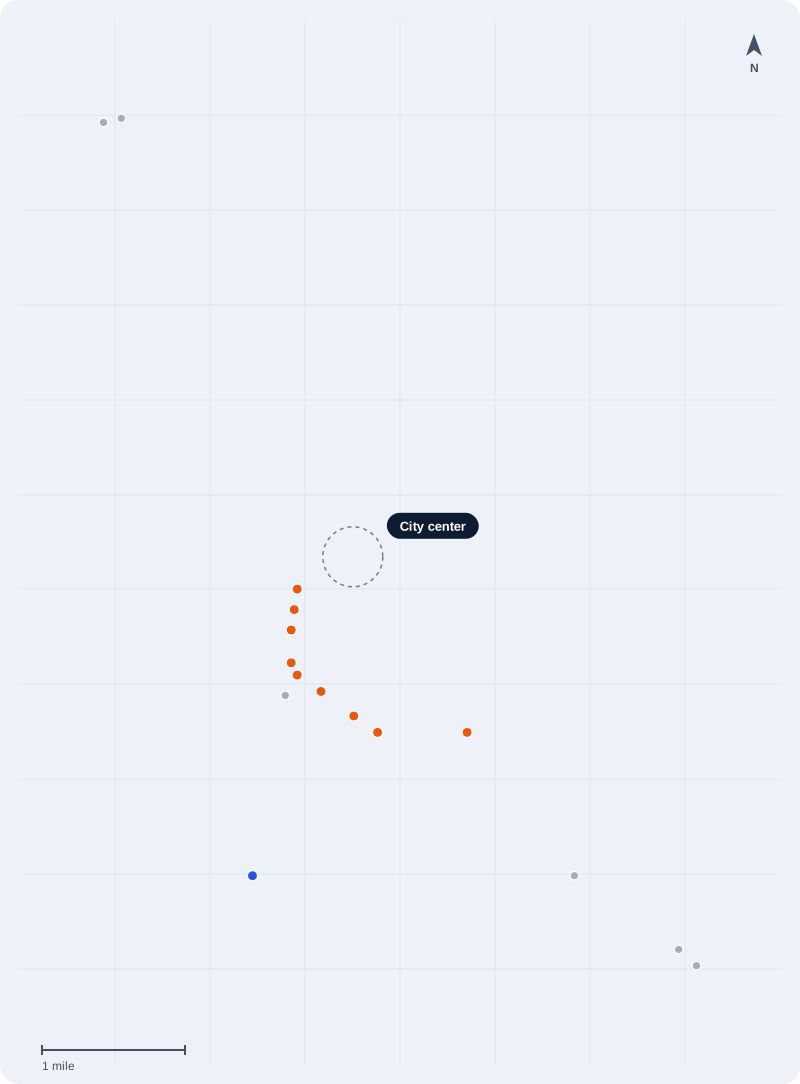
Each dot is one public at-grade crossing in the FRA inventory, colored by what its record reports.
Legend
- Night trains, no quiet zone9
- In a quiet zone0
- Daytime trains only1
- No reported daily traffic6
Orange dominates. Most crossings with any traffic report night trains and sit outside a quiet zone.
No green dots. No public crossing here is reported in a quiet zone, so routine horn sounding is the default.
Gray is not silence. It means no daily count was reported, not zero trains.
Busiest rail crossings in Perris
Reported through trains per day (day 6 AM–6 PM, night 6 PM–6 AM). Includes light rail and commuter operators. One train passes several crossings — don't add rows together.
What this means for a home search in Perris
Horns are the default. None of the 16 public crossings is reported in an FRA quiet zone, so routine horn sounding at public crossings applies under the federal Train Horn Rule. Distance to the nearest crossing matters more here than in cities with broad quiet-zone coverage. Train horns near a house.
The highest counts come from passenger rail. 11 of the 16 crossings are on transit or commuter lines such as Metrolink (SCRRA), with counts up to 16 trains a day. Railroad-company lines report little traffic here, so the busiest-crossing list includes every operator.
Crossing incidents. FRA accident reports list 0 highway-rail incidents at 0 of these crossings between January 2021 and August 2026. That is a safety record for vehicles and pedestrians, not a noise measure. How to read crossing accident history.
Railroads with public crossings
- Metrolink (SCRRA) 11
- BNSF 3
- Southern California Railway Museum 2
Transportation noise in Perris
How many residents live where roads, rail or aircraft produce a modeled 24-hour average of 55 dB or more outdoors, the level EPA's 1974 noise guidance used for residential areas.
- All transportation0%of residents at 55 dB+
- Roads0%of residents at 55 dB+
- Rail0%of residents at 55 dB+
- Aircraft0%of residents at 55 dB+
5% of residents live where transportation noise averages 45 dB or more, 0% at 55 dB or more and 0% at 60 dB or more, less than the typical city. That ranks 271st of the 299 cities we cover (median 3%). Method: each of the city's 39 census block groups is placed at its 2020 population center and given the level the USDOT National Transportation Noise Map (2020 traffic, ~30 m grid) shows there. It is a simplified national model of average sound, not a measurement; train horns and flyovers are far louder than the average. Check one address for the level at that home.
Weather and natural hazards in Perris
Summer days average 92°F with nights around 60°F; winter averages 66°F by day and 37°F at night. NOAA 1991–2020 climate normals at March Afb, 12.5 km from the city center.
- Days at 90°F or hotter100a year
- Days at 100°F or hotter21a year
- Nights below freezing25a year
FEMA National Risk Index: Riverside County
How expected losses from each hazard compare with other U.S. counties; ratings rise with population and property value as well as weather. Rated higher than most: river flooding, wildfire, heat wave. Check the census tract for a specific address in the report.
- River flooding Very High
- Wildfire Very High
- Heat wave High
- Winter storms Moderate
- Tornadoes Moderate
- Cold wave Very Low
- Hurricanes Very Low
Before you make an offer
Find the nearest crossing
Horns sound at crossings, so distance to the crossing matters more than distance to the track.
Read its night count
Note night trains, quiet-zone status and count year for that crossing ID.
Visit after 10 PM
Listen outside, then inside with windows closed. Feel for vibration.
Ask the neighbors
Has traffic changed since the count year? Counts are estimates, not schedules.
More detail: how many trains pass near my house, freight train noise at night and the vibration checklist.
The map shows the city. Your address shows your nights.
Nearest crossing, day and night trains, quiet zone, speed and incident history for one property.
Common questions about trains in Perris
Do trains run at night in Perris?
9 of 10 crossings with reported traffic list trains between 6 PM and 6 AM. Check the specific crossing near a home, because night traffic varies by line.
Are there railroad quiet zones in Perris?
None of the 16 public crossings in this set is reported in an FRA quiet zone, so routine horn sounding is the default at public crossings.
Which railroads operate in Perris?
By number of public crossings: Metrolink (SCRRA) (11), BNSF (3), Southern California Railway Museum (2).
How fast do trains go through Perris?
The highest maximum timetable speed reported at these crossings is 60 mph. Many urban crossings report much lower limits; the busiest-crossing list shows the speed for each.
Is Perris a noisy place to live?
About 0% of Perris residents live where modeled transportation noise averages 55 dB or more over 24 hours (USDOT 2020 noise map), less than the median city among the 299 we cover. Noise varies block by block, so check the specific address.
How hot does it get in Perris?
Perris averages about 100 days a year at 90°F or hotter and 21 at 100°F or hotter, with summer highs near 92°F (NOAA 1991–2020 normals).
Does it freeze or snow in Perris?
About 25 nights a year drop below freezing. Winter nights average 37°F.
Sources and limits
Crossing counts come from the FRA Crossing Inventory (Form 71, current), filtered to open, public, at-grade crossings whose inventory city is Perris (records reported as in or near the city). Incident counts come from FRA highway-rail accident reports (Form 57), January 2021–August 2026. Train counts are railroad-reported estimates with the listed count year; they are not live schedules, noise levels or safety ratings. Read our source coverage and limitations and corrections policy.